RetailDec 18, 2025
Retail Analytics: People Counting and Store Heatmaps
Knowing how many people walk in is just the start. Hot zones, dwell time and real conversion rates from in-store vision analytics, explained.
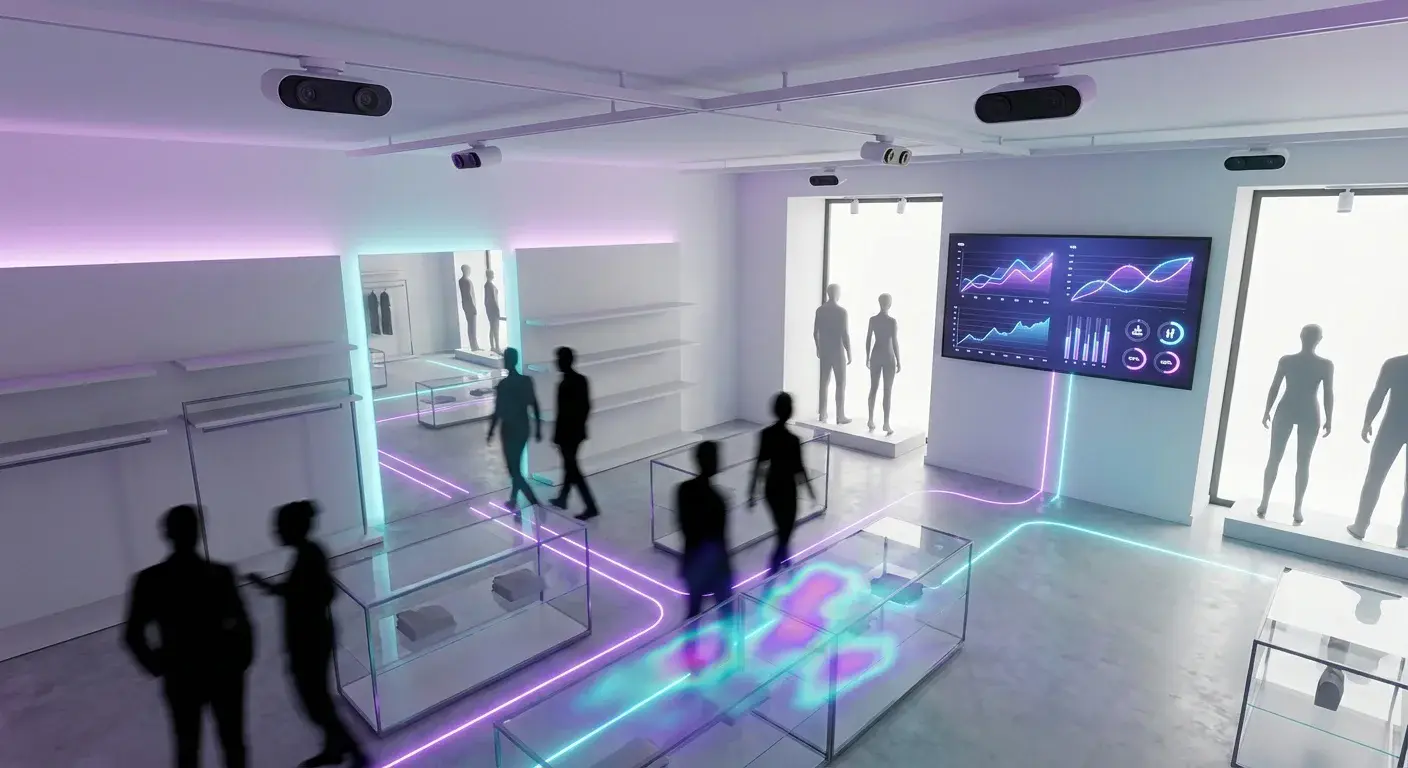
The Physical World's Blind Spot #
An e-commerce site knows EXACTLY where you click, what you look at, how long you spend on each product, when you abandon your cart and how far you got before leaving. Amazon knows that if you look at a product for more than 15 seconds but don't buy, you'll get an email with a 10% discount within 2 hours.
A traditional brick-and-mortar store KNOWS NOTHING. It only knows how much it sold at closing time. It doesn't know:
- How many people came in (vs. how many bought). A 5% conversion rate? 50%? No idea.
- Which aisles are "dead zones" nobody visits.
- How long people wait in line (the #1 cause of walkouts).
- Which products people pick up but DON'T buy (a sign of high price or low perceived quality).
Retail analytics brings e-commerce intelligence into the real world. If you want to compete with Amazon, you need data.
Vision Technologies: From Simple Counter to Full AI #
Level 1: Beam Sensors (Basic)
An infrared sensor at the door. It counts +1 when someone crosses. Problem: it can't tell an adult from a child, a shopping cart or someone walking in and out 3 times. Accuracy: 70-80%. Obsolete.
Level 2: 3D Stereoscopic Cameras
Two ceiling-mounted cameras (like human eyes) that see in 3D. The algorithm detects "heads" and tracks them. It filters out carts, small children (height under 1.2 m) and groups (2 people together = 1 visit). Accuracy: 95-99%.
Level 3: Overhead AI Cameras (State of the Art)
High-resolution (4K) ceiling cameras with deep learning models (YOLO, MobileNet) running on edge AI hardware. They don't just count; they UNDERSTAND:
- Dwell time: "The shopper spent 8 minutes in the sneaker section but didn't buy." Signal: missing sizes or high prices.
- Traffic heatmaps: A heatmap of the store showing which zones are "hot" (heavy traffic) and which are "cold" (nobody goes there). Use it to optimize the layout.
- Queue management: Detects lines of more than 3 people and alerts the supervisor: "Open register 3 NOW."
The King KPI: Conversion Rate #
The Golden Formula
Conversion Rate = (Sales Tickets / Traffic) × 100%
If 500 people walk in and you ring up 50 tickets = 10% conversion.
Diagnosis:
- Low conversion + high traffic = a service, stock or pricing problem (NOT a marketing problem).
- High conversion + low traffic = a marketing or location problem.
Dynamic Staffing with Predictive ML #
Retail's biggest pain point is long lines. Predictive analytics combines historical data (2 years) with real-time data:
"It's 11:45 AM on Friday. Historically, 50 people arrive in the next 15 minutes (the office lunch rush). Current traffic: 12 people in the store. Prediction: in 20 minutes there will be a line of 8. ACTION: Open register 3 NOW."
In a scenario like this, average wait time drops from 4.5 min to 1.2 min and NPS (customer satisfaction) rises by 18 points.
Illustrative Example: A Clothing Retail Chain #
12 Stores, 8 Months of Data
Findings:
- The "Accessories" aisle had only 3% of the traffic but a 22% margin. It was moved to the front. Sales in that aisle: +67%.
- Entrance window displays: people looked but did NOT come in. Low-priced products went into the window. Traffic: +12%.
- Saturdays 4-6 PM: peak traffic but 4% conversion (vs. an 11% average). Reason: long lines, so people left. Two extra registers were opened during that window. Conversion rose to 9%.
Result: more sales with the same stores and the same traffic.
Privacy: The Elephant in the Room #
The cameras do NOT record identifiable faces; they're designed with GDPR and Chile's Law 19.628 on the protection of private life in mind. They rely on:
- Anonymous by design: They only register "silhouettes" or "3D points." No faces.
- Edge processing: The analysis happens IN THE CAMERA. Only metadata is sent ("5 people entered at 14:22"), not video.
- Zero-day retention: No video is stored (unlike traditional security cameras).
Conclusion: Data or Die #
Improving the in-store experience is the only way to compete with Amazon. And experience is managed with data, not gut feeling.
A retailer that doesn't measure conversion, dwell time and heatmaps is sailing blind through a hurricane. Amazon has the data. You can have it too.
Topics
- retail analytics
- people counting
- store heatmap
- dwell time analytics
- retail conversion rate
- in-store computer vision

About the author
Bárbara RuzCTO
iGromi's CTO. Leads the architecture of iGromi OS and the platform's technical direction, turning messy industrial processes into elegant data flows.