SustainabilityDec 18, 2025
Industrial Decarbonization: Measuring the Real Footprint
Greenwashing is over. Companies must report Scope 1, 2 and 3 emissions with auditable data, not Excel estimates. How to measure with sensors.
The End of Greenwashing: Welcome to the Era of Audited Carbon Accounting #
Historically, corporate sustainability reports were marketing exercises. Once a year, the "Sustainability" team filled out an Excel sheet with rough estimates: "We used about X MWh, multiplied by the average grid emission factor → we emitted Y tons of CO₂e." A nice number, a green logo, a photo of solar panels. Done.
Those days are over.
The European Union's CSRD (Corporate Sustainability Reporting Directive, mandatory from 2024 onward) and similar regulations in California (SB 253) already require auditable, granular and verifiable data. Not estimates. Real measurements.
In Chile, the Energy Efficiency Law 21.305 already requires large energy consumers to report their energy use, and that starts with measuring it process by process.
ESG investors now demand "proof of carbon" before they invest. Companies that can't show their real carbon footprint with hard data simply WON'T get capital.
The Architecture of "Green Data": From Joules to CO₂e #
To measure the real carbon footprint of an industrial operation, you need to connect three worlds that have historically never talked to each other:
1. Measuring Energy Inputs (Scope 1 + 2)
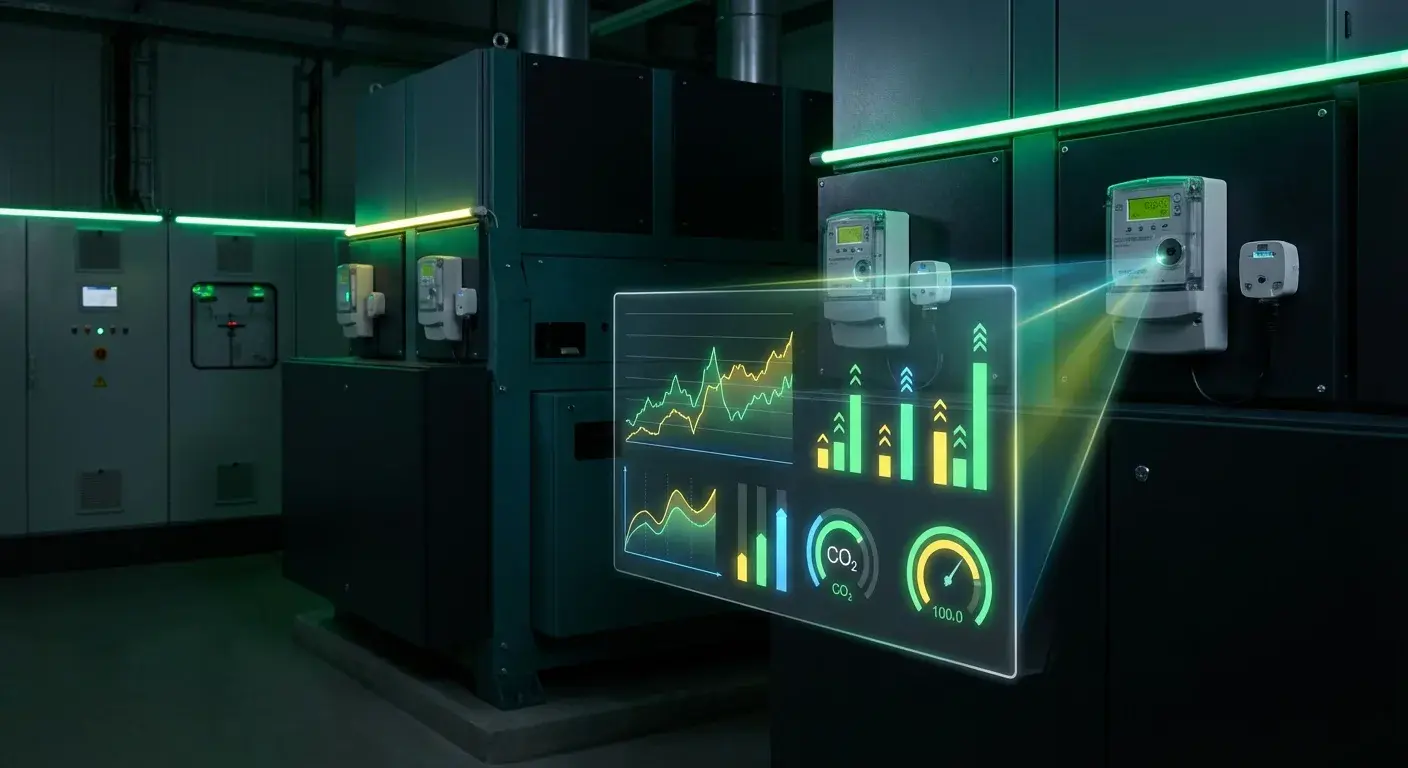
- Electricity: Three-phase smart meters at the main service entrance AND on every distribution panel (critical lines: compressors, ovens, lighting).
- Natural gas: Thermal mass flow meters on boiler and furnace lines.
- Diesel/fuel oil: Volumetric meters on generator tanks and in-plant vehicles (cranes, forklifts).
- Other: LPG, coal, biomass (if applicable).
Every meter should transmit data every 15 minutes (not manual monthly readings). Standard protocol: Modbus TCP/RTU or MQTT Sparkplug for interoperability.
2. Measuring Production Output (from the MES/SCADA)
Production counters (parts, tons, liters, whatever your unit is) time-synchronized with the energy meters. That lets you calculate the golden metric:
Energy Intensity = kWh / Unit Produced
E.g., 2.3 kWh/kg of finished product
This number is the definitive KPI. If it goes down month after month, you're improving. If it goes up, you're getting worse (more energy to make the same thing = inefficiency).
3. Dynamic Emission Factors
Not every kWh carries the same carbon. A kWh generated from coal emits ~900 g of CO₂. A kWh from hydro emits ~24 g. Chile's electricity mix changes EVERY HOUR depending on how much solar and wind is coming in vs. how many thermal plants are running.
Platforms such as Electricity Maps or the WattTime API provide the grid emission factor in real time (updated hourly). Your system should consume that API and calculate:
CO₂e_hour = kWh_consumed_hour × Grid_Emission_Factor_hour
Catching the "Energy Vampire": Phantom Loads #
When you monitor in real time at 15-minute granularity, you uncover absurd patterns that used to be invisible:
Illustrative example: a plastic injection molding plant
After installing submetering, the plant discovered:
- 40% base load on weekends while the plant was SHUT DOWN. What was going on?
- 3 air compressors feeding constant leaks (3/4" lines full of holes).
- Outdoor lighting on 24/7 (broken photocell).
- 2 conveyors forgotten in "stand-by" running mode.
Annual cost of the waste: electricity paid for machines that weren't producing anything.
How it gets fixed: patch the air lines, replace a photocell and program the PLC to shut off the conveyors; a minor cost next to what was being lost.
Footprint reduction: 180 tons of CO₂e per year.
Scope 3: The Final (and Hardest) Frontier #
Scopes 1 and 2 are "your direct operation" (easy to measure with sensors). Scope 3 is EVERYTHING ELSE:
- Emissions from your suppliers (raw materials, inbound transportation).
- Emissions from the end customer's use of your product.
- End of life of the product (recycling, disposal).
Scope 3 can be 80-90% of a company's total footprint. Measuring it requires cooperation across the entire supply chain.
The REAL Financial Value of Being Low-Carbon #
1. CBAM: A Carbon Border Tax
The European Union introduced the CBAM (Carbon Border Adjustment Mechanism) in 2023. If you export steel, cement, aluminum or fertilizers to Europe, you're charged according to the carbon embedded in your product.
A Chilean steelmaker that can prove a footprint 30% below the global average PAYS 30% LESS = a direct competitive advantage.
2. Green Financing
Banks such as the IDB and KfW, along with ESG funds, offer interest rates 1-2% lower to companies that can show verified decarbonization trajectories. On a large five-year loan, that rate difference adds up to meaningful interest savings.
Conclusion: To Measure Is to Manage, to Manage Is to Survive #
From 2025 onward, you won't have a choice. Regulators, investors, customers and employees will demand carbon transparency. Companies that show up late will pay enormous costs: regulatory fines, lost access to capital, exclusion from supply chains.
The good news: the technology is cheap and the payback comes fast. You start by finding the brutal waste (leaking compressed air, machines running overnight) that pays for itself in weeks.
Don't wait for the regulator. Start today.
Topics
- industrial decarbonization
- carbon footprint measurement
- scope 1 2 3 emissions
- energy submetering
- carbon accounting manufacturing
- cbam

About the author
Bárbara RuzCTO
iGromi's CTO. Leads the architecture of iGromi OS and the platform's technical direction, turning messy industrial processes into elegant data flows.