IIoT ConnectivityMay 7, 2026
Industrial IoT Monitoring: Sensors, Dashboards, Latency
The three layers of industrial IoT monitoring: sensor and PLC data acquisition, edge filtering, and a live plant dashboard everyone can read.

The End of the Silent Factory #
IoT monitoring (Internet of Things) is no longer an innovation; it has become a basic survival requirement. If you can't see in real time what temperature your oven is running at or how many cases per minute your packer is putting out, you're flying a plane blindfolded.
The 3 Layers of IoT Monitoring #
To roll out a monitoring system that works, you have to accept that sensors on their own are useless. The value lives in the software layer.
Layer 1: Physical Acquisition (IoT Sensors)
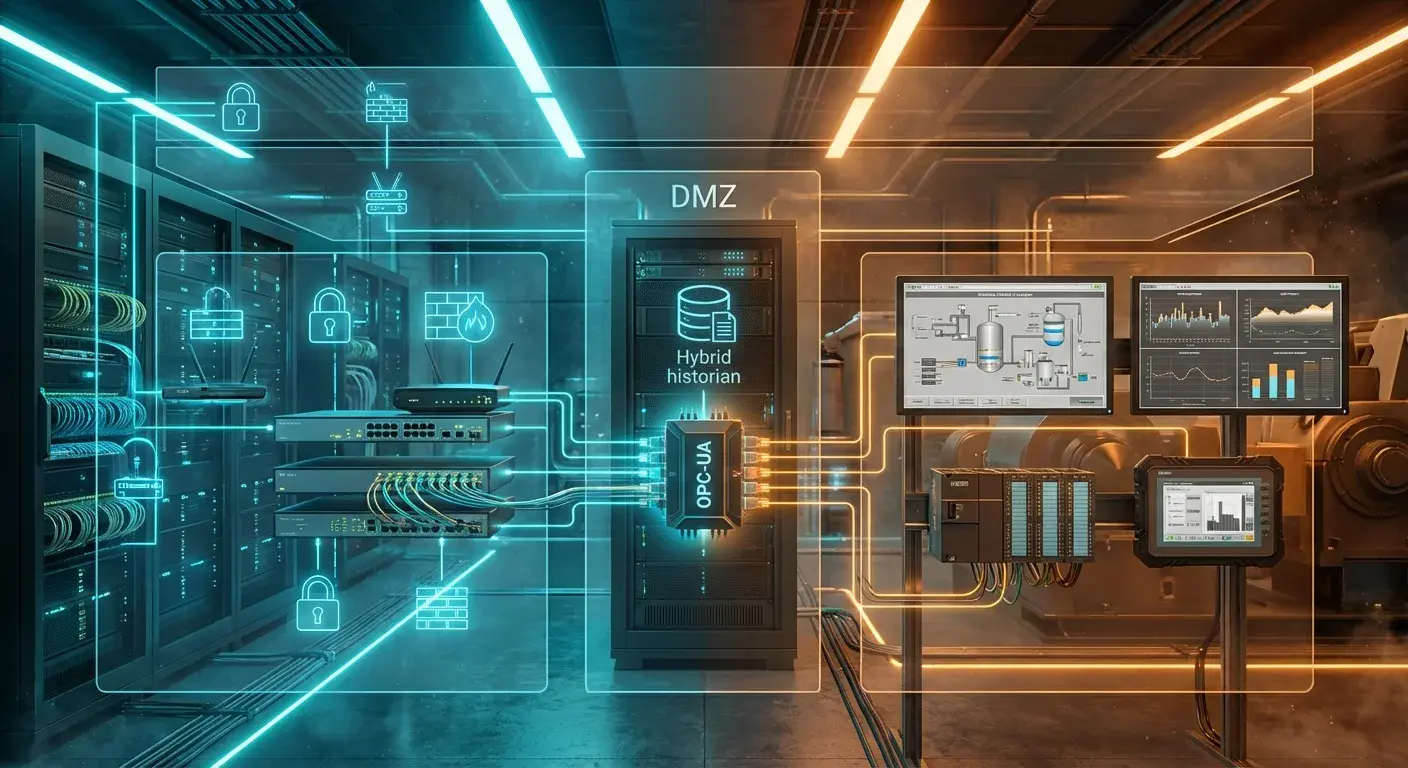
Vibration, temperature, acoustic or vision sensors are installed on the machinery. If the machines are modern (PLC), you don't need extra sensors: the gateway connects directly over Modbus or OPC-UA and pulls the manufacturer's native telemetry.
Layer 2: Filtering at the Edge (Edge Computing)
Sending 10,000 data points per second to the cloud will break your monthly budget. This is where Edge Computing comes in. An industrial gateway intercepts the data, strips out the "noise" and sends only what matters, compressed and encrypted.
Layer 3: The Live Dashboard
The processed data is fed into a system such as iGromi OS. You no longer have to code complex SCADA screens in Visual Basic. The graphics engine brings up a dark-mode dashboard at 60 FPS, viewable on any TV on the plant floor (Andon) or on the plant manager's phone, in real time.
Topics
- industrial iot monitoring
- iiot monitoring architecture
- iot sensors manufacturing
- edge computing iot
- real-time plant dashboard
- andon dashboard

About the author
Víctor RuzCEO
Automation and Robotics Engineer (Universidad Andrés Bello, 2012). More than twelve years in robotics and industrial automation. Founder and CEO of iGromi, where he connects machines, systems and plant people with secure industrial AI.