Energy monitoring
that pays for itself.
Real-time energy monitoring system for industrial plants. Track electricity, gas, water, and compressed air — per machine, per line, per shift. Identify waste, reduce costs, meet ESG targets.
The Problem
You pay the energy bill
without knowing where it goes.
One monthly bill, zero insight
The utility sends a total. You pay it. But which machine consumed what? Which shift wastes power? Compressed air leaks cost thousands — you never know.
Invisible waste
Machines idling on weekends. Compressors running at full pressure all night. Conveyors running empty. None of it shows up on the bill until you measure machine by machine.
No baseline, no targets
Without per-machine submetering, you can't set energy KPIs. ISO 50001 requires baseline data. ESG reporting needs auditable consumption numbers you don't have.
The Solution
Energy monitoring system
per machine, per line, per second.
Real-time submetering
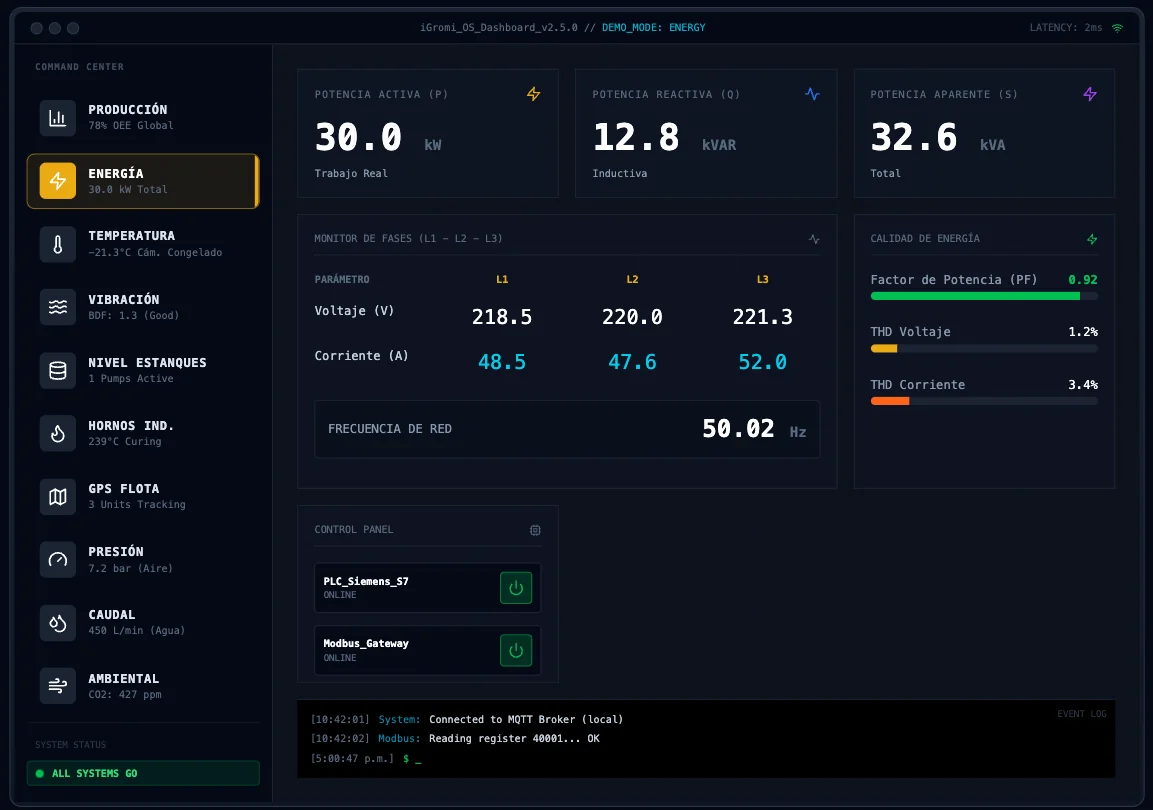
CT clamps and smart meters on every machine, panel, and line. See kW, kWh, power factor, and demand — live. Know consumption before the bill arrives.
Energy analytics & baselines
Establish baselines per machine and shift. Detect anomalies automatically. Compare lines, shifts, and plants. Turn energy data into actionable savings.
Cost allocation by cost center
Assign energy costs to production lines, departments, or SKUs. Know the true energy cost per unit produced. Justify efficiency investments with hard data.
What you get with iGromi Energy
1 · What your plant already has
- The plant’s electrical panels
- Per-phase energy meters
- Running status from the PLC
2 · The iGromi node on site
- Measures power, power factor and harmonics
- Cross-checks consumption with output
- Keeps the history on site
3 · What your team gets
- Consumption per machine and shift
- An alert on abnormal consumption
- Energy per unit produced
You can't manage
what you don't measure.
In 30 minutes we'll show you how iGromi Energy gives you per-machine visibility into every watt, liter, and cubic meter your plant consumes.
Request a demoHow is this rolled out in a plant that is already running?
The same five questions come up in every meeting, whichever solution is on the table. The answers depend on how the system works, not on the module.
Do I have to replace my PLC or my SCADA?
No. The system connects to what is already installed and reads from it; it does not replace the control layer and does not write to it unless that is explicitly defined. If the PLC does not expose its parameters, the iGromi Bridge discovers them by trying combinations until it gets a response, and if the machine speaks no protocol at all it is read by a sensor on the electrical signal.
Does it work if the internet goes down?
Yes. Processing happens at the Edge, inside the plant, so capture, rules and inference keep running with the link down. What stops is remote access and outbound synchronisation, which resumes on its own when the connection returns.
Does my data leave the plant?
Not by default. Video and telemetry are processed on the customer's Edge device. What leaves, and where it goes, is defined when the system is configured. That is the same property that underpins compliance with Chile's Ley 21.719 and what makes this viable in mining and in food.
How long until the first data point?
It depends on how many machines there are and what they expose. A line with equipment that speaks Modbus is read in days; a line of silent machines needs sensors installed and panel shutdowns coordinated, and that is set by the plant's maintenance calendar, not by us. The usual sequence is assessment, pilot, expansion.
What happens to what we already measure by hand?
It runs alongside during commissioning. For the first weeks the manual record keeps going in parallel as a validation counterpart: it is how you find out whether the automatic figure beats the handwritten one, and the habit is dropped on its own once that is demonstrated.
Related solutions
Industrial IoT platform
Connect sensors, gateways and actuators in a single data layer.
Machine condition monitoring
Real-time OEE
Availability, performance and quality calculated automatically from PLCs and cameras.